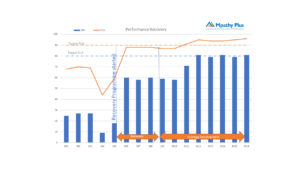
I know from looking at our website statistics that Call Centre KPi’s are one of the most common searches. I also know that on most occasions when we review a Contact Centre, we are asked to provide some recommendations about future KPI’s.
KPI’s are a major consideration for organisations and Contact Centres in particular. In this two-part blog we look at how we should use KPI’s, what should they be and provide examples of KPI’s that could be used.
Firstly, what is a KPI? Well it stands for Key Performance Indicator. It is not a measure, or a target, or an objective. It is an Indicator of Performance.
The challenge for many Contact Centre managers and Executives is to present a simple view of how well a Contact Centre is performing. Keeping it simple but informative is the key but many contact centres suffer as a result of presenting too much information and too much detail
There are three components to any operation. The skill for manager is to forecast demand, ensure that suitable resources are in place to meet demand and therefore deliver a successful output.
The KPI’s for many Contact Centres are the outputs. But is this correct?
Let’s take a look at what each of the above mean and how they can impact the overall picture.
- Demand
Demand is the workload, the tasks that need to be completed. In contact centres this typically consists of telephone calls, emails, chats or other customer contact channels. It can also include administrative and other lower demand activities. Forecasting demand is not just looking at the volume of activity; it also relates to the time when that demand exists and the effort (time) required to deal with it.
- Resources
Resources are normally thought of as being people and of course they are an important factor. People need to have the right skills and knowledge to be able to deliver the service required but also be available at the correct times to meet demand.
Other resources include technology; are the systems working effectively, knowledge; is there sufficient knowledge available and place; is the working environment suitable. All of these aspects contribute towards performance and meeting demand.
- Output
The output is normally seen as being the main provider of KPI’s for the Contact Centre. Typically, it focuses of how well the resources have met the demand but these are often presented in negative terms i.e.
- Percentage of Abandoned Calls
- Wait times for an answer
- Complaints received.
So, an initial observation is that there should be a focus on what has been achieved rather than what has not been achieved. If demand is higher than expected then it is likely that the Output will be reduced. However, the Contact Centre may have been performing well above expectations.
Report what has been achieved rather than what has not been achieved
If we now look more closely at measuring the performance of Contact Centre, we can again see a real issue as the Contact Centre does not have full control over its performance.
Demand is not generated by the Contact Centre but they are measured on how the react and respond to it
and
Demand is an indication of business performance not just the Contact Centre performance
The following scenarios indicate this where green indicates demand meets forecast and resources are all available, red indicates inaccurate forecasts or incorrect resources. When everything is as planned then the output is also green.
However, we can see that when we start to look at introducing incorrect demand or resources then the outputs are impacted.
It should also be remembered that having an under forecast or excessive resources is inefficient so therefore it reflects poor performance. This highlights the difference between a KPI and a target. For example, a target of answering 95% of telephone calls is reasonable but if the achievement is actually 100% then it is probable that there were too many resources.
The following scale highlights how this may work when using a traffic light type indicator. 95 is the target and anything above or below that is a variance. The colour is the indicator of performance.
| 90 | 91 | 92 | 93 | 94 | 95 | 96 | 97 | 98 | 99 | 100 |
Based upon what we have discussed so far in this blog, we recommend that KPI’s are aggregated into a balanced scorecard that provides a summary of performance but also enables deeper analysis if required. An indicative balanced scorecard is shown below with RAG indicators.
Each section would contain charts and data that explains the indicator together with a brief description where exceptions occur.
In the next part of this blog we will discuss some useful KPI’s and how they should be reported both internally and externally.


