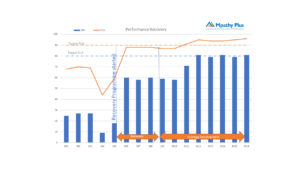
In the previous blog about KPI’s, we discussed how many Contact Centres have their performance assessed against criteria that often reflect the performance of the overall business rather than the Contact Centre. We discussed specifically how a sudden unforeseen increase in demand could make it impossible for the Contact Centre to achieve output based KPI’s.
It is imperative that any reporting clearly states that the Contact Centre is an operational function that has a maximum throughput. The outputs reflect the performance of the organisation although the Contact Centre has a significant role to play.
Balanced Scorecard
We previously started to discuss a balanced scorecard approach to reporting with high level RAG indicators as illustrated below.
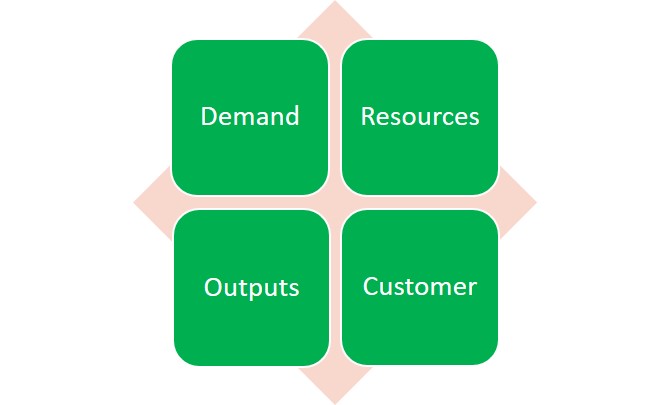
The 4 sections illustrated provide a holistic view of how the Contact Centre has performed. In the above case there are four areas which contain more detailed data but the overall picture shows that all areas are green which could mean that less analysis of the detail is required than if some were red or amber.
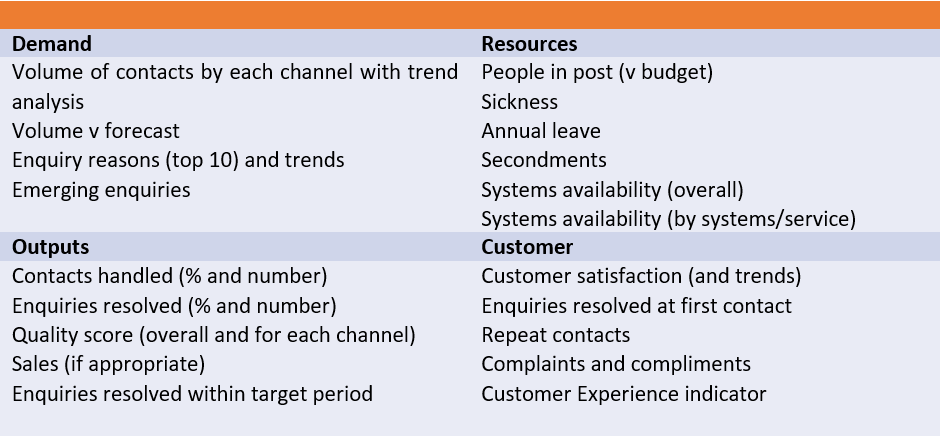
The next consideration is about the contents of the four areas.
The table provides some suggestions for items to include in a balanced scorecard.Remembering that every contact centre is unique it is expected that every scorecard would include items specific to that centre. These would normally be developed through workshops with stakeholders all providing input about what they would like to have included.
When looking at the performance of the Contact Centre itself, there are a number of the items reported above that are relevant. It is worth remembering that the team is a resource and the performance of the Contact Centre should be measured by the effectiveness of that resource. For example, if the forecasted volumes are correct and the resources are well managed and motivated then it is likely that the output will be good. As the role of the Contact Centre is core to the delivery of service to customers it is recommended that the scorecard should be used to present performance but on the understanding that it is delivering on behalf of the organisation and is not responible for all of the outputs.
There are two main challenges when measuring contact centre performance; what should we report on and how do we get the data? Far too often these two components have driven Contact Centre management to focus on what is easy to collect and report on. Many operations still focus on the time it takes to answer a telephone call and the abandonment rate as they are easily obtained from the system. Whilst some of this data may be useful, it does not provide the required information about overall performance.
Quantitative v Qualitative
The question over whether to use quantitative data about volumes/outputs or qualitative data relating to the quality of service is frequently asked. The answer is, if both are relevant then use both. Customers frequently report that they are more interested in the service they receive than the time it takes to engage with an organisation. This is a good starting point but consideration should be given to there being an initial expectation that contact will be made within a reasonable timescale. So it is necessary to report on both especially when attempting to understand the real level of service and the customer experience provided.
Strategic v Operational
A common mistake that many Managers make is they report on too many factors. The scorecard approach discussed previously highlights the areas that are important to those outside the Contact Centre as they represeent the service provided to customers. There are an additional range of reports and data available that are not intended as reporting content, they are intended to support operational management. For example, the average handling time for an enquiry is an essential piece of information when calculating future resources or comparing different Advisors. but it is not a reflection on the overall performance. This example is best illustrated by determining whether a shorter or longer duration is preferable. The answer is specific to that organisation and its strategy for customer service. The duration depends upon a number of factors including the content of the enquiry, the customers understanding of the resolution, the availability of knowledge to resolve the enquiry, the ability of the Agent and many other factors. A high quality service is measured more effectively by looking at the customers satisfaction and the resolution rates.
Presentation of Data
The illustration of the scorecards used above are basic to emphasise the simplicity. There are many models and tools available that make data and performance reporting more interesting and easier to understand. Using web based dashboards and infographics to share performance data is much more interesting than basic reports and the growth of gamification in Contact Centres is helping to share information in a motivational and achievement based way.
Summary
To summarise, KPI’s will vary from one organisation to another; there is no perfect set although it is possible to generate a template and then personalise them. They relate to a moment in time and reflect a number of different factors; some within control of the Contact Centre and other outside that control and responsibility. Using balanced scorecards will ensure that all relevant items and highlight areas interest. Performance should be presented in a simple but visual way that provides the assurance required. Finally, find out what the key KPI’s are and use them. Benchmarking is good but if you are successful you are only as good as your peers were last year. KPI’s will drive performance so it is essential that they are the right ones.